We love valuations. Each one is unique and contains fascinating challenges. Our Valuation Team has extensive experience in valuations of all asset types which they have acquired over the course of their careers. The expert commentary and nuanced valuations our surveyors provide has led many to wonder whether valuations are an artform or founded in science. We caught up with Paul Tebbutt, BSc MRICS MCIArb, our Head of Development Valuations, and asked him to offer his expert view.
I have often heard valuation described as an art rather than a science, and it is true that it cannot be reduced to a mathematical analysis. Nevertheless, scrupulous recording of the thought processes that go into valuations will provide the valuer with full confidence in both their methodology and thoroughness.
Anderson Wilde & Harris are panel valuers to many residential development lenders for whom we undertake development appraisals.
The first stage of the development appraisal process is assessing the projected value of a residential development when it is completed and the individual plots are available for sale, which is known as the Gross Development Value (GDV).
I shall start by outlining the methodology our valuers employ when assessing the GDV.
Although comparable evidence has been in use for decades, inconsistencies around its application and misunderstandings about best practice when ideal comparables are not available is still leading to negligence claims.
Of course, we all know that the best comparable is the identical flat or house next door that sold a few days before the date of valuation, but professional life is mostly not like that.
Setting Benchmarks
So, in the everyday situation, when we do not have the perfect direct comparable or comparables, it is necessary for us to make “qualitative” adjustments – essentially considering marginal features such as a balcony, a view, a car parking space, an en-suite, or “bad neighbour” uses, i.e., a pub or nightclub.
These are quite different matters from the “quantative” adjustments that consider tangible matters such as the number of bedrooms, the size of the property etc.
Since these attributes are not stored on databases, there is no scientific record of the significance of such features and determining the value differentials is down to the experience and opinion of the valuer.
Of course, opinions differ, and this is what makes the job interesting but in order to provide an accurate valuation the valuers need to make this aspect reasonably scientific.
The case study below demonstrates the methodology of setting benchmarks for qualitative and quantitative adjustments from comparables, in this case for a hypothetical new build block of flats above ground floor offices.
It provides a process to follow and a clear account of how a “beacon” value was arrived at – a beacon value is the comparative value of a selected unit type, from which the value of the other same unit types within the development follow, after in turn making appropriate qualitative and quantitative adjustments. An example of the former would be floor level – those lower down the building can be noisier and more insecure – those higher up can be lighter and enjoy better views. Typically, in London the market tends to account for the change in floor level either by around £5,000 to £10,000 or 1% per floor and which I seek to replicate.
Figures may vary but once a benchmark has been established, our valuers can provide a rationale for their conclusion. In this regard, it is no different for example from damp in one property costing £5,000 to repair, while the same kind of damp in another costs £15,000 because it is relatively more widespread and affects different elements of the structure.
The Method
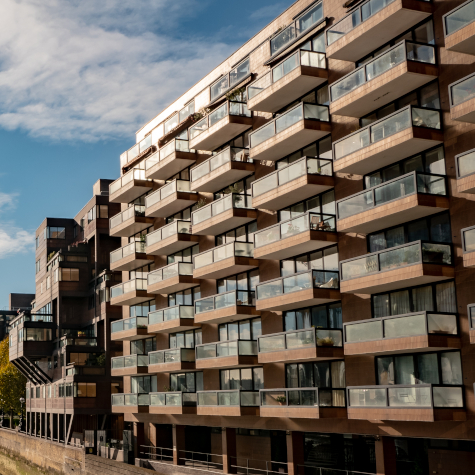
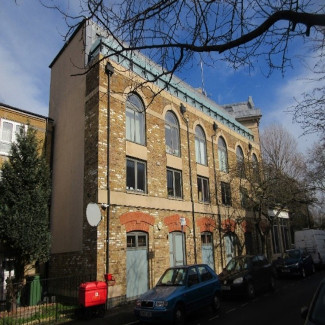
The below shows the beacon unit, a proposed new build, 2-bed/1 bath, 754 sq ft plus balcony, fourth floor flat within 400m of an Underground station and local shopping amenities.
Our Valuation Reports contain photographs and the addresses of the property being valued, as well those of the comparables. Please note that the information of this nature contained within this article is fictitious and included purely for illustrative purposes.
Subject Property: Orchid Street, SE16
 |
|
Next is a sample of four comparison 2-bed flats both new build and second hand – I use four here for the sake of brevity and illustrative purposes only – typically the valuer could look to source and rely upon a greater number of comparables – I have listed a narrative of their key features for comparison purposes and deriving a comparative value.
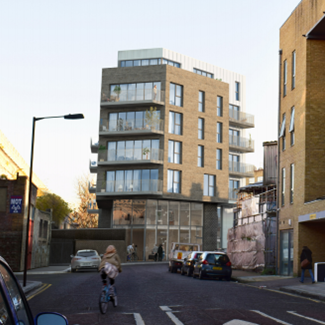
Comparison Property 1: Violet Road, SE16
 |
New build, medium spec., mixed use block, 2nd floor, 2- bed ,1 bath, 678 sq. ft plus balcony, mixed use area 1km to the south, on a busy main road neighboured by a railway line, no Underground connection within a 1km radius, sold for £500,000/£738 per sq ft. | Comparative value: Size +5.7% Higher floor +2% Railway line facing -5% Location (proximity to rail connection) +10% Net +12.7% = £564,000 |
Comparison Property 2: Daisy Road, SE16
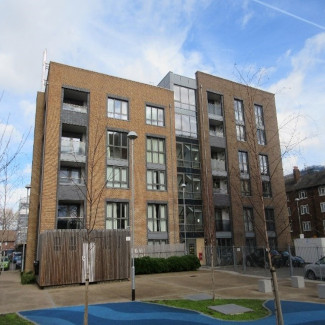 |
Second hand, circa 10-year-old flatted block, 2-bed, 2 bath, 3rd floor, 762 sq. ft plus balcony, around 800m from an Overground station, sold for £513,000/£673 per sq ft. | Comparative value: Lower floor -1% No en-suite -3% New build attributes +10% Railway line facing -5% Ground floor commercial -2% Location (proximity to rail connection and more frequent Underground service) +10% Net +9% = £559,000 |
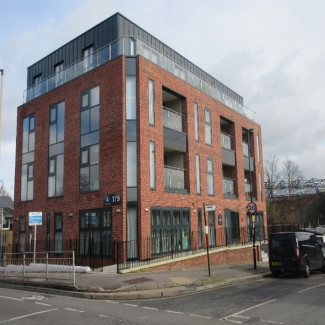
Comparison Property 3: Hyacinth Place, SE16
 |
Second hand, circa 10-year-old warehouse conversion, 1st & 2nd floor, 2-bed,1 bath, 750 sq ft, park aspect, average condition, sold 12 months’ ago for £525,000/£700 per sq ft. | Comparative value: Higher floor +2% Lateral configuration +3% Outside space +3% Inferior setting/Railway line facing (combined) -10% Ground floor commercial -2% New build attributes and condition +12% Change in market (location adjusted Land Registry House Price Index) -2% Net +6% = £557,000 |
Comparison Property 4: Carnation Wharf, SE16
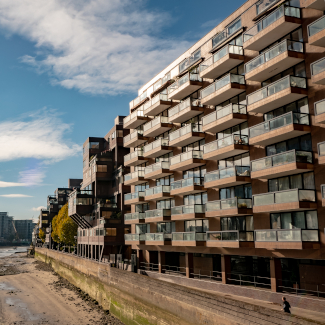 |
Second hand, 1st floor, 2010s residential block, 2-bed,1 bath, 700 sq ft plus balcony, good condition, riverside setting, sold for £610,000/£871 per sq ft. | Comparative value: Size +3.8% Higher floor +3% New build attributes +10% Railway line facing -5% Ground floor commercial -2% Non-river aspect -20% Net -10.2% = £554,000 |
The analyses show how these differences between the comparable and the subject can be accounted for by qualitative and quantitative adjustments.
The £ per sq ft reference alongside the sale price is the measure for adjusting for differences in size. The concept of a rate per sq ft is now well transitioned from commercial to residential property and increasingly London buyers will be informed by it. My knowledge and experience tells me that the market does not behave in a linear way when it comes to floor area. Accordingly, a quantum allowance will be made for above average size units and an inverse quantum allowance for those of below average size. Based on my analysis, broadly every 1 sq ft of overage area will attract only around 50% of the equivalent rate per sq ft value. So, if for example a standard size 550 sq ft, 1-bed flat sold for £400,000/£725 per sq ft, it would not follow that an oversized 650 sq ft unit would value up by the same rate per sq ft at £475,000, but rather £435,000, in the absence of supporting evidence.
The point is to try and identify what valuation differentials realistically reflects the value of the subject property.
When capital values vary significantly, as they can do, in the case study from £500,000 to £600,000, only careful analysis can reveal the underlying information the valuer needs to support a conclusion. After analysis, the comparative value range in the case study is £554,000 to £564,000 and I base my valuation of £560,000 on the weighted average, attaching the highest weight to the strongest comparable, no.1, which displays the most similar qualitative and quantitative characteristics to the subject property.
Conclusion
The above shows how an objective analysis of the material factors that differentiate one property from another not only adds more objectivity and robustness to the valuation process but provides a sound defence against potential future claims of negligence.
Whether you need a commercial or residential valuation, we are here to help. You can speak to Paul or another member of our Valuation team on 0800 071 5517. Alternatively, please email admin@awh,co.uk and a member of our team will get back.